Design & Art Portfolio
Case Study: MSU-Northern info displays
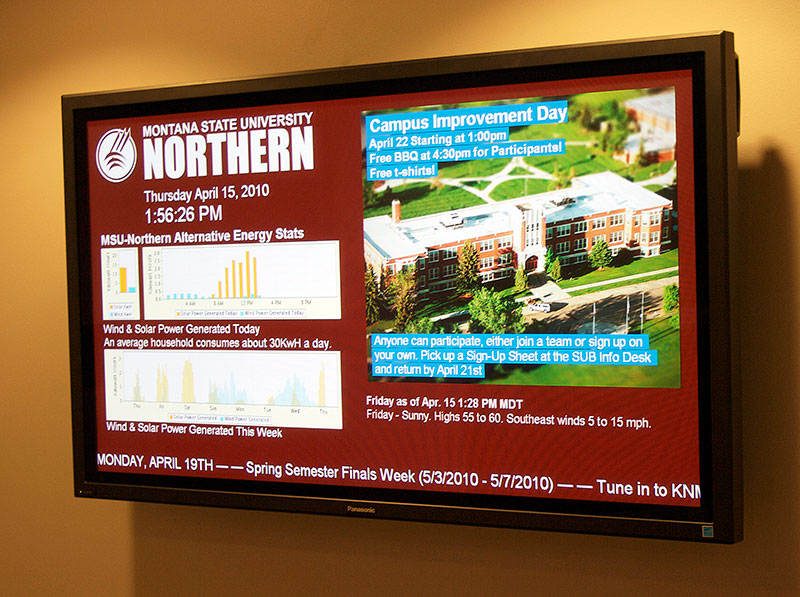
In addition to my normal responsibilities at the Bio-Energy Center at Montana State University Northern, I was also given access to Northern's information displays, a series of networked forty-inch LCDs spread around campus, intended to promote campus events, important dates, etc.
The system in place when I arrived was... primitive. A proprietary, unstable, difficult piece of shareware ran the displays; one component the software used was PowerPoint Viewer '97. Installing and using a newer version of PowerPoint on the host computer rendered the display software inoperable.
Working in consultation with Andy Morris, an IT professional at Northern, I developed a much cleaner, stable, easier to update system. Instead of proprietary software, the new system was simply a custom-coded, locally hosted web page built on simple HTML, CSS, Javascript and iframes. Andy came up with a startup script for the LCD's server computer, making it load the display page in Chrome (which has an excellent full-screen mode) on an automatic schedule.

A small javascript displayed the time and date, while another script animated a scrolling ticker at the bottom of the screen. An RSS feed supplied local weather.
 Instead of some kind of pseudo-powerpoint javascript, I ended up using a Google Documents slide show as the basis for a rotating events feed. Since the slide show was "in the cloud," it was easy to edit and update from anywhere, and easy to give access to other Northern staff. To prevent it from looking like a generic bulleted powerpoint, I used large, colorful, high-res images as the basis for each slide, and used Google Document's handy text high-lighting tool to make the text stand out. This style was actually inspired by CNN International's graphics style of a few years ago.
One of the stand-out features I utilized for the display system is the energy generation graph. MSU-Northern's sustainable technology program includes a solar panel and a wind turbine on the campus grounds, both of which are tied into the local electrical grid. A renewable energy technology company, Fat Spaniel, offers an energy "insight platform" that monitors the energy use and production of connected solar and wind generators.
Using their web platform, you can create live-updated energy charts. This image is updated live, and represents the energy generated every hour in the last week by MSU-Northern's solar panel and wind turbine.